
You can argue that if you’re not willing to react with equanimity to a market price decline of 50 percent two or three times a century, you’re not fit to be a common shareholder and you deserve the mediocre result that you’re going to get.
— Charlie Munger, BBC Interview, October 2009
 One of the most common mental errors facing investors is the tendency to anchor on various round numbers. This tendency has been in the spotlight today with the Dow Jones Industrial Average nearing the 14,000 level. Putting aside the fact that the industrial average is a highly flawed benchmark, does it make any sense to attach meaning to a specific nominal level of a market index over long periods of time?
Rather than focusing on the valuation of the industrial average, it seems more interesting to examine Berkshire Hathaway because the stock is also approaching a “round number” of $150,000 per class A share. Berkshire’s record high closing price was on December 10, 2007 at $149,200 per share and its intra-day high was on December 11, 2007 at $151,650. Only fifteen months later, the stock closed at $72,400 on March 9, 2009, a decline of over 52 percent from its record high. The stock has advanced 104 percent since the nadir to a recent $148,000. In this article, we take a look at Berkshire’s valuation in December 2007 and compare it to the company’s valuation today in an effort to determine whether investors should be anchoring on the magic $150,000 level.
Book Value Growth since 2007
As Warren Buffett has stated on many occasions, growth in Berkshire’s book value per share can serve as a useful proxy for growth of intrinsic value over time even though book value significantly understates the intrinsic value of the business. Mr. Buffett elaborated on this point in his 2011 letter to shareholders:
We have no way to pinpoint intrinsic value. But we do have a useful, though considerably understated, proxy for it: per-share book value. This yardstick is meaningless at most companies. At Berkshire, however, book value very roughly tracks business values. That’s because the amount by which Berkshire’s intrinsic value exceeds book value does not swing wildly from year to year, though it increases in most years. Over time, the divergence will likely become ever more substantial in absolute terms, remaining reasonably steady, however, on a percentage basis as both the numerator and denominator of the business value/book-value equation increase.
If the correlation between book value and intrinsic value provides clues regarding Berkshire’s valuation, it makes sense to examine how Berkshire’s book value has progressed over the past five years. The exhibit below shows book value per A share from September 30, 2007 to September 30, 2012 which is the last date for which financials have been made available:

Growth of 7.6 percent per year is normally not something to get very excited about. However, taking into account Berkshire’s size and the fact that this growth was delivered during a period encompassing the worst economic downturn since the Great Depression, this seems like a respectable overall performance. Book value was more than 44 percent higher on September 30, 2012 compared to its level five years earlier.
Berkshire’s Price-to-Book Ratio
A very simple metric for gauging Berkshire’s valuation is the price-to-book value ratio. This ratio simply compares Berkshire’s trading price at any given time to book value per share. Since there is a lag between the end of each quarter and the time when shareholders are able to review financials, we are still working with September 30, 2012 book value even though it is almost certain that December 31, 2012 book value is higher. The exhibit below shows Berkshire’s price-to-book value ratio from January 1, 2007 to February 1, 2013:
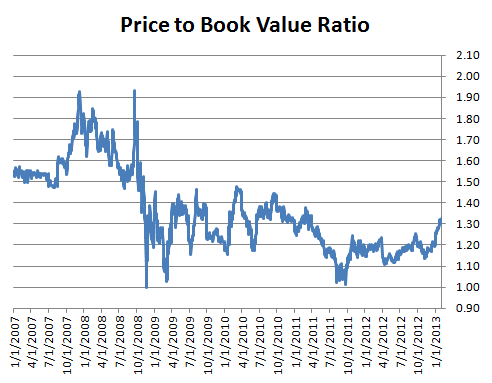
It is obvious that Berkshire’s price-to-book ratio has fluctuated dramatically over the past six years. At the start of 2007, the ratio hovered around 1.5 which is near the average ratio for Berkshire since the turn of the century. However, by December 2007, the ratio rose dramatically to 1.93 which coincided with the stock’s record high. After falling back to its historical average over the first nine months of 2008, the ratio became extremely volatile rising back to 1.93 very briefly in September 2008 and then plummeting to 1.0 exactly two months later in November 2008. Of course, this was the period of maximum uncertainty in the fall of 2008 when it was not clear whether the financial system would survive.
One can examine the subsequent years in more detail, but the general point of the chart is to show that Berkshire’s price-to-book ratio has never risen back to its historical average of 1.5. Although the stock has more than doubled from its low point in March 2009, the price-to-book ratio has never exceeded 1.5 and has approached 1.0 on a number of occasions. When Berkshire began trading close to 1.0 times book value on a sustained basis in Q3 2011, Warren Buffett decided to authorize a buyback of shares at prices up to 1.1x book value. The buyback limit was subsequently raised to 1.2x book value in December 2012.
Conclusion
We have not attempted to present a comprehensive valuation of Berkshire Hathaway in this brief article. However, a complete valuation of the company is not needed to emphasize the point that a nominal level of $150,000 per share for Berkshire is meaningless without considering the context in which the stock price reaches that level. The change in Berkshire’s book value per share is a crude but approximate way of gauging changes in intrinsic business value over time. The 44 percent growth in book value per share over the past five years clearly shows that we are dealing with a very different valuation scenario at $150,000 in February 2013 versus December 2007.
Statements like “Berkshire has not been this expensive in over five years” are meaningless and misleading if put in any context related to the company’s valuation. If one wishes to crudely approximate the price at which Berkshire would have to trade at today to be as “expensive” as it was in December 2007, it makes more sense to look at the price-to-book ratio from December 2007 and apply it to Berkshire’s last reported book value figure. Using that approach, Berkshire would have to trade above $215,000 per share today to be as expensive as it was in December 2007 based on price-to-book value. Of course, this is not to suggest that Berkshire’s intrinsic value is anywhere close to $215,000 today.
A crude approximation of intrinsic value could involve applying Berkshire’s historical price-to-book ratio of 1.5 to September 30, 2012 book value and arriving at $168,000 per share. Based on the 1.5x ratio, Berkshire’s shares in December 2007 were only worth about $116,000 per share rather than $150,000 per share. However, the reader is cautioned to treat price-to-book ratios as only crude benchmarks. Additional approaches to valuation can be found in The Rational Walk’s 2011 report on Berkshire Hathaway.
Disclosure: Individuals associated with The Rational Walk LLC own shares of Berkshire Hathaway.