

W R. Berkley Corporation is an insurance holding company operating in a variety of niche markets requiring specialized knowledge regarding a particular territory or product line. The company was founded in 1967 by William R. Berkley who currently serves as Executive Chairman. The founder’s son, W. Robert Berkley, Jr., has been with the company for eighteen years and became Chief Executive Officer in 2015.
W. R. Berkley has expanded mostly through organic growth over nearly a half century. Of the company’s 51 operating units, 44 were organized and developed internally. From 1974 to 2015, management compounded per-share book value (with dividends included) at an annualized rate of 17.3 percent compared to 10.8 percent for the S&P 500 over the same period. With common stockholders’ equity of $4.6 billion at the end of 2015 and a current market capitalization of $7 billion, management continues to believe that the company’s business model can achieve long-term risk adjusted returns of 15 percent after tax.
Company Culture
There is usually a negative correlation between the length of a proxy statement and the utility of the document for investors. Despite filing a lengthy proxy, the material presented by W. R. Berkley provides quite a bit of insight into the firm’s culture, much of which is based on how employees are compensated for long term performance. Unlike many other businesses, the performance of an insurance company can only be evaluated over long periods of time. This is because loss reserving can resemble more of an art than a science. The estimates made for a given fiscal year are certain to be incorrect in the long run because actual losses will almost always vary from estimates. High quality insurers put in place systems to reject inadequately priced business even if it means that premium volume will decline. Additionally, conservative insurers will usually err on the side of overestimating reserves which can generate “favorable development” in subsequent years as reserve estimates are revised downward.
The exhibit below, which is taken from the company’s proxy, illustrates the insurance cycle and management’s approach to dealing with each phase of the cycle.
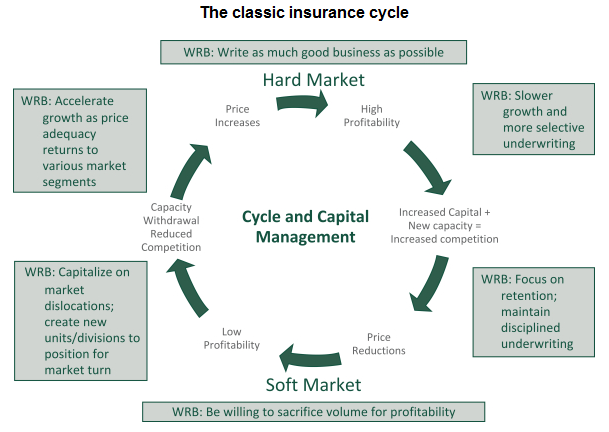
Every insurance company will claim to follow W. R. Berkley’s approach during soft markets which involves being willing to sacrifice volume for profitability. However, this is much harder in practice than in theory since underwriters are often tempted to retain market share even if the business they are underwriting might prove unprofitable in the future. If this unwarranted optimism filters into reserving judgments, unpleasant surprises are sure to follow in future years as “unfavorable development” results in charges for prior years when management was insufficiently conservative.
W. R. Berkley’s compensation philosophy appears to be aligned with management’s approach to the insurance cycle. Annual cash bonus payments primarily emphasize the extent to which the company’s annual operating return on equity achieves the long term 15 percent target. Long term incentive plan awards are tied to book value per share growth, are subject to claw-backs, and payouts below target levels have not been uncommon. In order to encourage long term behavior, restricted stock awards remain deferred, even after fully vested, until the executive is no longer employed by the company. Hedging is not permitted.
The summary compensation table from the proxy appears below:
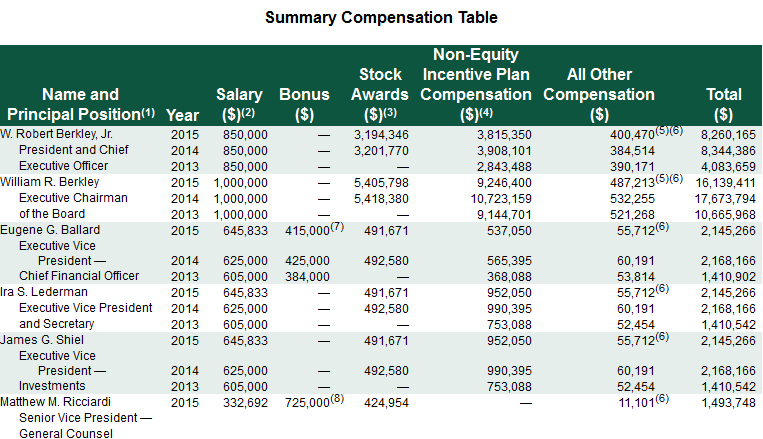
Aggregate compensation is certainly generous but at least appears to be based on factors aligned with shareholder wealth creation. Perhaps most notably, William R. Berkley continues to maintain a substantial interest in the company with 20.4 percent of shares outstanding. While it would be nice if Mr. Berkley adopted Warren Buffett’s “founder’s philosophy” of taking only symbolic pay, this is perhaps unrealistic for most companies so we prefer to focus on whether the incentives are properly aligned with smaller minority shareholders.
Strong Underwriting Record
W. R. Berkley targets a combined ratio in the low 90s and this goal has been met over the past decade with an average combined ratio of 93.6 percent. A combined ratio under 100 percent indicates that the company operated with underwriting profits. The combined ratio is the sum of the loss ratio and expense ratio. The chart below shows W. R. Berkley’s net premiums earned along with the loss, expense, and combined ratios over the past decade:

It is interesting to note that management’s actual behavior has been consistent with the philosophy illustrated in the “classic insurance cycle” exhibit that appears above. Premium volume was reduced early in the decade as pricing was inadequate to induce management to write policies, but has picked up in recent years as pricing firmed.
We should note one trend in the chart which is very important: As premium volume decreased from 2006 to 2009, the expense ratio increased quite substantially. This is because management did not attempt to reduce operating costs commensurate with the decline in premiums. Should we regard this as good or bad? Shouldn’t management aggressively seek to cut costs during times when business slows down? While cutting wasteful spending is always a good idea, aggressively cutting headcount during soft markets creates perverse incentives for underwriters to look for business regardless of ultimate profitability. We can see that the expense ratio has decreased somewhat in recent years although it is still elevated compared to 2006-2008 levels. Presumably, the company is in a good position to work on expense ratio reductions now that premium volume is growing again. We regard the track record over the past decade to be a good indicator that the company’s stated culture is, in fact, something that employees are regularly practicing rather than just serving as talking points from investor relations.
Business Segments
W. R. Berkley operates in three segments: Insurance – Domestic, Insurance – International, and Reinsurance. Domestic insurance is, by far, the company’s most important segment accounting for 77 percent of revenue and 83 percent of pre-tax income in 2015. International insurance accounted for 13 percent of revenue and 11 percent of pre-tax income while Reinsurance provided 10 percent of revenue and 6 percent of pre-tax income. The exhibit below provides a summary of business segment performance over the past four years. The company had a different segment organization prior to 2012.

Domestic insurance gross premiums in 2015 came from the following lines: Other liability (31.8%), workers’ compensation (27.9%), short tail lines (21.2%), commercial auto (9.7%) and professional liability (9.4%). The segment is highly decentralized with a large number of independently operating units none of which provides more than eight percent of gross premiums. These businesses appear to participate in niche markets that focus on industries and products where in depth knowledge and expertise can add value. This is evident based on the combined ratio of the group which is the lowest of all company business segments.
International insurance writes business in over sixty countries through a decentralized operating structure. The segment is heavily focused on short tail lines, representing over fifty percent of gross premiums, and posted a combined ratio under 100 percent in three of the past four years. The reinsurance group appears to run opportunistically with premium volume varying more than the other segments and showing declines over the past three years. Primary markets include the United States, United Kingdom, Continental Europe, Australia, South Africa, and the Asia-Pacific region. The reinsurance combined ratio has been under 100 percent in three of the past four years.
Overall, W. R. Berkley is primarily a domestic specialty/niche insurer with that segment driving overall company performance. Given management’s willingness to reduce premium volume during soft markets and the demonstrated track record, particularly in the domestic specialty markets, it appears that the company has a good chance of achieving its targeted combined ratio in the low 90s over long periods of time.
Investments
Along with underwriting profits, insurance companies derive profits through the investment of shareholders’ equity and policyholder float. Float represents funds that are available for investment during the time between receipt of premiums and the eventual payout of policyholder claims. Although float is a balance sheet liability, it has a positive value to shareholders as long as the cost of float (underwriting losses divided by float) is below the rate of return achieved through investment of the funds. As we have seen, W. R. Berkley has achieved combined ratios under 100 percent over the past decade which means that policyholder float has been available for investment at negative cost.
Most insurance companies invest primarily in fixed income securities and typically attempt to match the duration of the fixed income portfolio with the expected duration of its liabilities. W. R. Berkley’s investment strategy has attempted to limit the duration of the fixed income portfolio (3.3 years as of December 31, 2015) and to supplement returns through investment in equity securities, merger arbitrage strategies, investment funds, private equity, loans, and real estate projects.
The exhibit below, taken from the company’s 2015 10-K, shows the composition of the investment portfolio at the end of 2015:
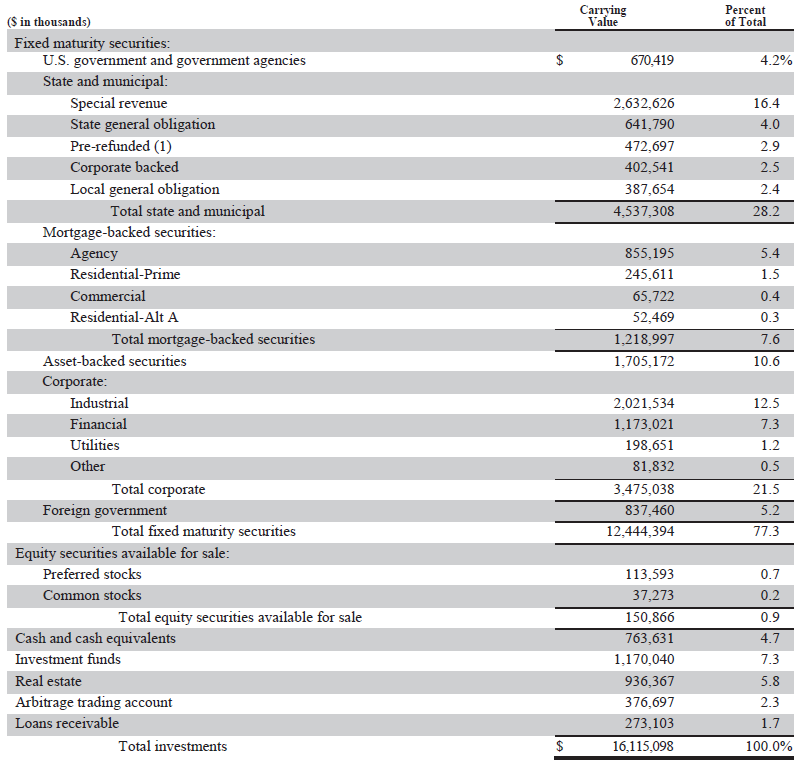
Fixed maturity investments, at $12.4 billion, represents 77.3 percent of the investment portfolio and exceeds policyholder float, which we estimate to be approximately $9.9 billion. Over time, the company has shifted away from equity securities which represents less than 1 percent of the portfolio. Instead, management has put cash to work in a number of alternate asset categories including investment funds (7.3% of the portfolio), real estate (5.8%), merger arbitrate (2.3%) and a portfolio of loans (1.7%).
In addition to the investment portfolio, the company has wholly owned investees which are not included in the investment portfolio but provide revenue to the company reported in the income statement. These businesses are managed through Berkley Capital LLC. Berkley Capital’s investment criteria and portfolio companies are listed on their website. Although granular disclosure of the results of these subsidiaries is not provided in W. R. Berkley’s annual report, the strategy is interesting to note because it seems to emulate Berkshire Hathaway’s strategy in some ways.
The annual report provides some limited insight into the strategy behind the company’s non-traditional investments:
“As interest rates declined in recent years, it became difficult to maintain a high-quality portfolio with a duration that reflects the average life of our liabilities, and still obtain adequate yields. The variables under our control are the quality, duration and liquidity of the fixed-income portfolio. We were neither prepared to reduce the quality of our portfolio, nor were we willing to extend the duration since that could exacerbate our potential exposure to inflation. Thus we felt we had two alternatives. The first was to marginally reduce short-term liquidity by buying securities that might not provide immediate liquidity, but were of the highest quality. The second was to expand our investments in private equity, limited partnerships and real estate to improve returns. We have experience in all of these areas, and they have delivered excellent returns over many years.
Investments in these areas now represent an amount equal to approximately half of our shareholders’ equity. So far, this strategy has proven to be rewarding. Although the income is not reported in as consistent a manner as income from bonds, the internal rate of return is well above the 3-4% we would have received from fixed-income securities, and we have not sacrificed quality or increased risk. In addition, because accounting rules require us to carry many of these investments under the equity method, there is a significant amount of unrealized gains embedded in our portfolio that is not recognized on our balance sheet. The single most visible investment of this type is Health Equity (HQY), which we took public in 2014. If we were to sell our interest in any of these projects in any given year, our ROE would be positively impacted.”
Although the move toward non-traditional investments seems to be at least partially driven by the low interest rate environment, success in this area could result in W. R. Berkley finding additional opportunities for reinvestment. Since the company has regularly returned cash to shareholders via dividends and repurchases over the years, additional opportunities for internal reinvestment could result in more attractive (and tax efficient) growth for continuing shareholders in the long run.
Conclusion
W. R. Berkley is a very high quality insurance company. While the company has not posted underwriting results on par with RLI Corporation, which we recently profiled, the valuation assigned by the stock market is much more reasonable. Book value per share was $37.31 as of December 31, 2015 and shares recently traded at about $56.50. A price-to-book ratio in the 1.5x range doesn’t appear to be unreasonable for a company with W. R. Berkley’s track record and, by this measure, the shares trade at a level that compares favorably to Markel Corporation. We have covered Markel on a number of occasions over the past year and have noted its emerging status as a “mini-Berkshire”.
Recently, Morningstar published an article calling into question Markel’s status as a “mini-Berkshire” and suggesting that W. R. Berkley offers a better value. Although W. R. Berkley’s price-to-book ratio is indeed lower than Markel’s, it doesn’t appear that W. R. Berkley is as far along with its development of non-insurance subsidiaries compared to Markel. The Morningstar analyst puts an emphasis on underwriting profitability as an indicator of whether an insurer has an enduring “moat” and doubts whether Berkshire’s approach of reinvesting in non-insurance subsidiaries can be successfully emulated. He claims that attempting to emulate Berkshire could take management’s focus away from underwriting performance.
We will probably not know the outcome of Markel’s attempts for many years but it is clear that the company is explicitly trying to emulate Berkshire. The same does not appear to be the case for W. R. Berkley. Based on management’s statements, it seems like the shift toward private equity and other non-traditional investments has a great deal to do with the current low interest rate environment. It will be interesting to see how W. R. Berkley’s investment strategy evolves once the interest rate environment eventually normalizes. The company is definitely worth tracking for anyone interested in exposure to a U.S. focused niche insurer with potential upside from wise investments.
Disclosure: No position in W. R. Berkley.