
In general, investors are best served by ignoring most headlines, tuning out the daily market chatter, and focusing on in-depth fundamental research into the factors that influence the long-term intrinsic value of a business.
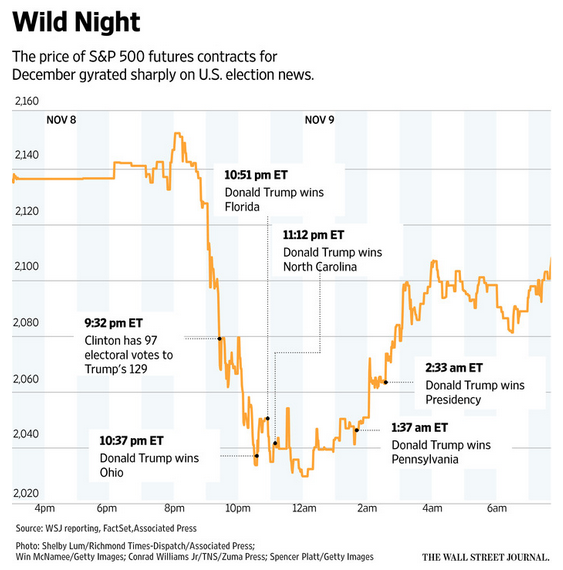
If that actually comes anywhere close to describing your activities this week, it is safe to say that you have superhuman discipline! Those of us who are less disciplined have been focusing on the United States presidential election and the wild market gyrations that took place once it became apparent that Donald Trump was on a path to victory. The following Wall Street Journal chart from election night shows how extreme the reaction was when it became obvious that Mr. Trump was on a path to victory:
On Wednesday and Thursday, stocks rose strongly which is precisely the opposite of the conventional wisdom put forth by market “experts” prior to the election. Stocks were supposed to rally if Hillary Clinton prevailed and to fall if Donald Trump pulled out an upset victory.
There is no point in analyzing this situation in much depth other than to say that the intrinsic value of the overall market could not possibly have tracked the wild market gyrations that we have seen. At a micro level, the same is true for Berkshire Hathaway which opened at $218,930 on Wednesday morning and closed at $233,750 today. This represents a record high close for Berkshire and puts the total market capitalization of the company at $384 billion.
Fundamental Factors?
Are there any fundamental reasons behind Berkshire’s price behavior since the election? One possible explanation is that the policies of the Trump administration are expected to result in significant fiscal stimulus which could lead the Federal Reserve to increase interest rates at a faster pace. With $85 billion of cash on the balance sheet, Berkshire would benefit materially if interest rates normalize over the next couple of years. Another possible explanation has to do with the gains recorded in Berkshire’s equity portfolio, especially the recovery in the share price of Wells Fargo which has reached levels that prevailed prior to news of the fake account scandal that broke in early September. Additionally, many of Berkshire’s subsidiaries could benefit from Mr. Trump’s infrastructure spending plans. BNSF could benefit from a resurgence in the coal industry as well as increased transportation of oil if new land is opened to drilling. On the other hand, the energy business could be negatively impacted if the Trump administration proves less friendly to renewable energy initiatives.
It is not productive to speculate too much regarding how Berkshire’s business will be affected by the election. However, given the fact that Berkshire is at a record high, it is interesting to revisit the valuation to determine whether the stock price remains reasonable. Let’s take a quick look at where things stand.
Price to Book Value
Price to book value is a longstanding measure that Berkshire Hathaway investors typically follow closely. One reason is that Warren Buffett has set the threshold for repurchasing Berkshire stock at 1.2x book value. Since the turn of the century, Berkshire’s average P/B ratio is 1.48x. However, since 2008, the average ratio is only 1.34x. Based on reported book value of $163,783 as of September 30, 2016, Berkshire’s current P/B ratio is 1.43x. This is slightly below the average since 2000 but above the average that has prevailed since 2008.
The exhibit below provides a long-term view of this measure of value. The dark red line on the second chart shows the repurchase threshold which was originally set at 1.1x book value in 2011 and later raised to the current 1.2x book value.

From a price-to-book ratio perspective, it seems like Berkshire is well within a “reasonable” range of value if one looks at the average level that has prevailed since 2000. It is interesting to note that shares trade toward the lower level of the range that existed prior to 2008. The financial crisis marked a shift in the average P/B ratio assigned to Berkshire stock. However, over time, the gap between fair value and book value should increase rather than decrease because more of Berkshire’s value resides in wholly owned subsidiaries rather than marketable securities. The economic goodwill of growing wholly owned subsidiaries will never be reflected in book value whereas marketable securities are carried at full value.
Two Column Valuation
The price-to-book ratio is not really a valuation methodology but simply represents an easily calculated number that we can track over time. There are many other approaches for calculating Berkshire’s intrinsic value, many of which have been discussed on The Rational Walk over the years. For purposes of our discussion today, let’s take a look at another easily calculated measure of value. The two-column valuation approach assigns an earnings multiple to Berkshire’s pre-tax earnings (excluding investment income and investment gains and losses) and then adds the market value of investments and cash on the balance sheet.
The exhibit below provides a low, medium and high valuation scenario using different pre-tax earnings multiples:

Keep in mind that the multiples shown above are on a pre-tax basis with the medium scenario pre-tax multiple of 10x roughly translating to an after tax multiple of 15x. At the bottom of the exhibit, we can see the P/B ratio that each scenario translates to. The low scenario roughly matches the long term P/B ratio since the turn of the century while the other scenarios are more in line with Berkshire’s typical P/B ratio prior to the financial crisis.
Conclusion
This brief article is not sufficient to fully think through Berkshire’s valuation and both methods are relatively crude. Berkshire’s non-insurance subsidiaries are so diverse that a more in depth sum-of-the-parts valuation is clearly warranted. Nevertheless, there is some value in coming up with “ballpark” figures to see if today’s record high signals some kind of exuberant sentiment on the part of Mr. Market. Both the price-to-book and two column methods suggest that Berkshire’s price is not unusually high.
Only time will tell how the new administration reshapes U.S. economic policy and what effect this will have on American business generally and on Berkshire specifically. For now, we can only conclude that the “Trump Rally” has not created any irrational exuberance in Berkshire’s stock price even as it breaches prior record highs.
For further insights regarding valuation methodologies for Berkshire Hathaway, please review In Search of the Buffett Premium. This report is several years old but the information regarding the two-column approach is still applicable today.
Disclosure: Individuals associated with The Rational Walk LLC own shares of Berkshire Hathaway.